AI email template builder
Create professional newsletters and marketing emails in seconds. Just describe your idea, and our AI email generator builds a stunning, brand-ready template for you. No design skills or coding required.
Try Touchpoint now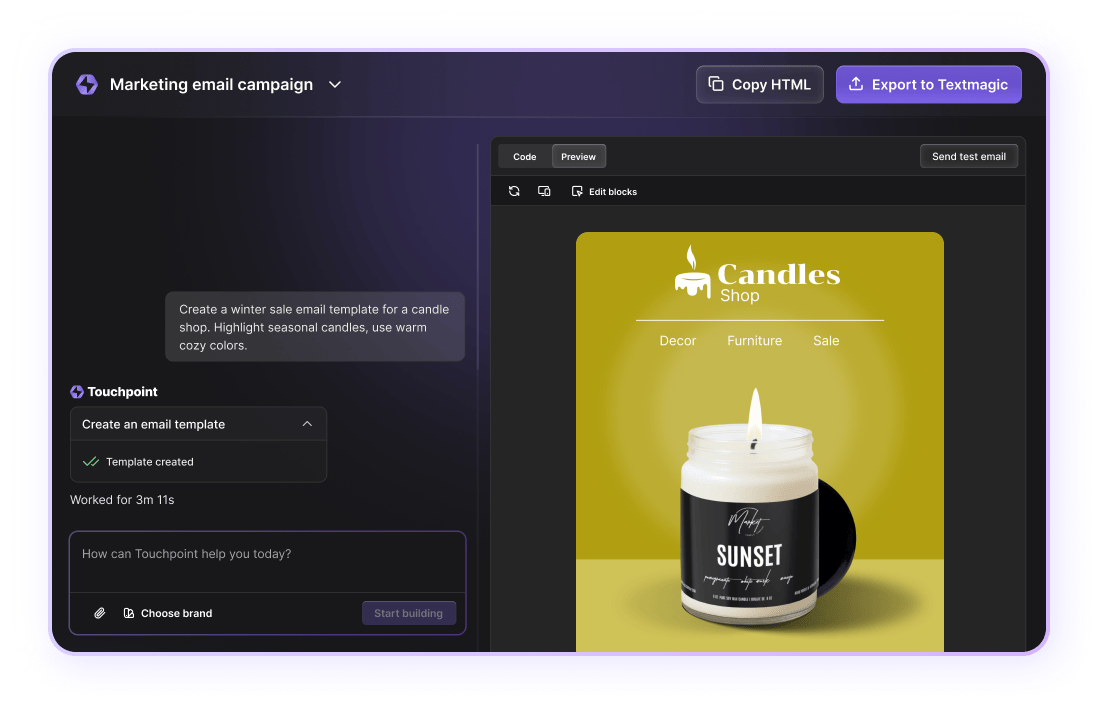
Black Friday bonus! Get 25% extra credit on your first top-up with code BF2025 — Claim your bonus →
Create professional newsletters and marketing emails in seconds. Just describe your idea, and our AI email generator builds a stunning, brand-ready template for you. No design skills or coding required.
Try Touchpoint now
Make beautiful data visualizations with Gantt Chart Maker Tool. Unlike other online graph makers, our tool isn’t complicated or time-consuming. There’s no learning curve – you’ll get a beautiful graph or diagram in minutes, turning raw data into something that’s both visual and easy to understand.
Step #1: Select graph or diagram type.
Step #2: Add your data or information.
Step #3: Change the colors, fonts, backgrounds, etc.
Step #4: Download, print or share.
Learn more about each type of graph and find the right one for your project by browsing our categories below.

A pie chart is a diagram showing the different components that make up a whole. It is a useful way to show fractions or percentages at a glance.

A donut chart is a kind of pie chart where the center has been removed. The area in the center can be used to display information.

A line chart is a useful way to document changes over time. It can be used to show changes in several different data sets in the one diagram.

A bar chart is used to compare data across different categories. Each bar represents a category of data. The taller the bar, the bigger the number represented.
Explore our range of complimentary tools designed to enhance your experience.
Grow revenue and improve engagement rates by sending personalized, action-driven texts to your customers, staff, and suppliers.